Updating your browser will give you an optimal website experience. Learn more about our supported browsers.
Monitoring Investment Performance
At TCDRS, we’re constantly monitoring our investments. Measuring investment performance is all about benchmarks — comparing our performance to accepted industry indices.

The results are in
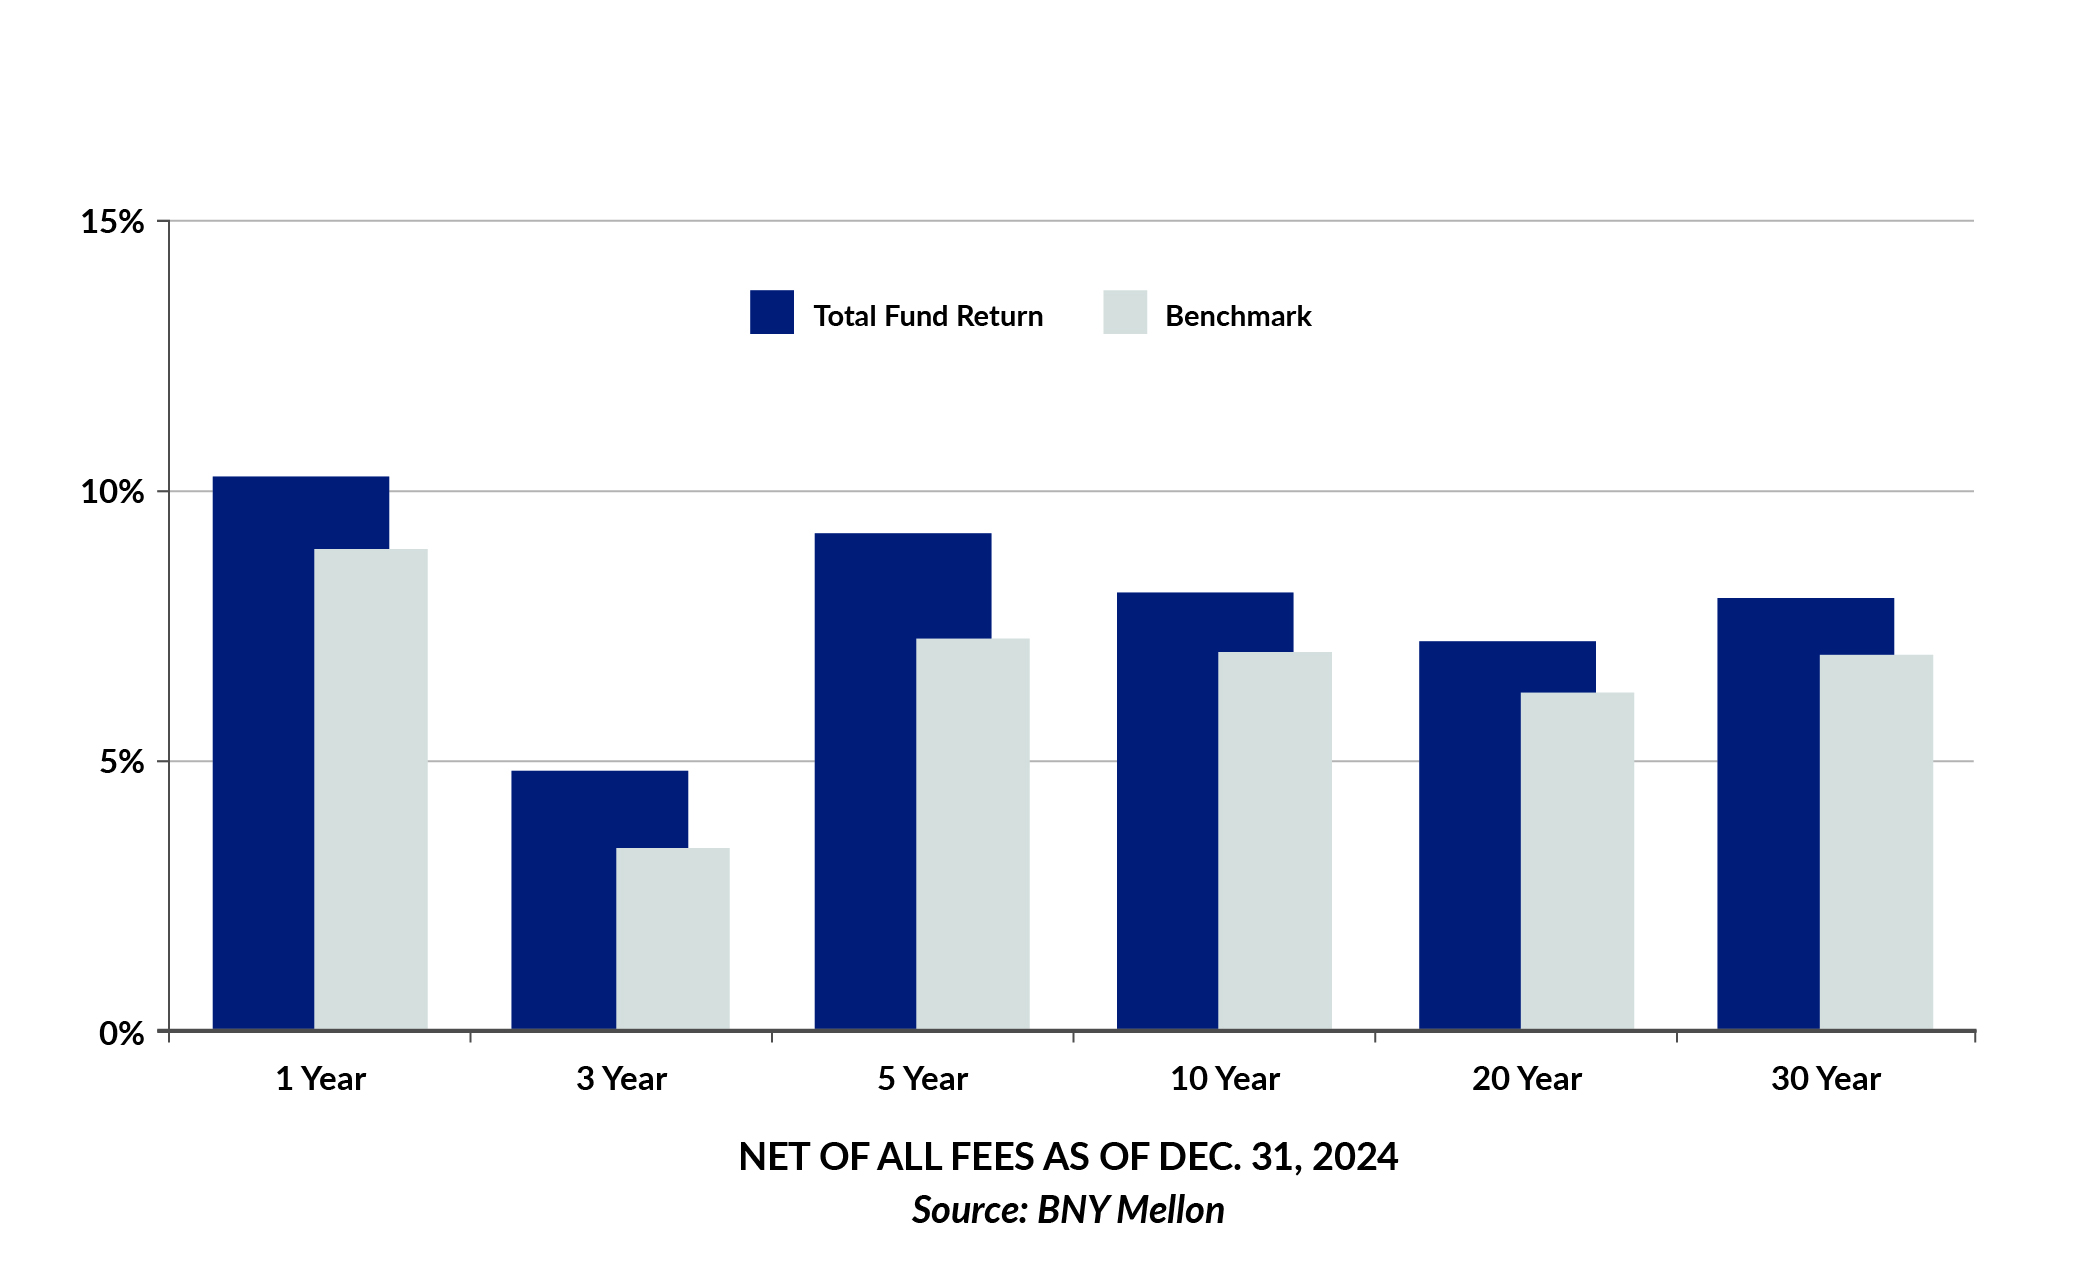
As of Dec. 31, 2024, our 1-year investment return is 10.3%, and we’ve outperformed our portfolio benchmarks over all major time periods.
See our results for yourself.
How TCDRS reports performance
All investment performance is reported net of all investment fees.
-
Quarterly
TCDRS reports performance at the end of each calendar quarter. Results for the private asset classes (private equity, distressed debt, direct lending and private real estate) are included on a one-quarter-lagged basis because results are not available until two months following quarter end. This is consistent with performance reporting by other institutional investors. Our most recent quarterly results are available on the Recent Activity page. -
Annual
In conjunction with the preparation of TCDRS’ Annual Comprehensive Financial Report, performance of the portfolio at the end of each calendar year is reported for all asset classes as of Dec. 31. The annual performance report is typically available in early June of the following year. All of the annualized returns shown in the Our Results tool are based on annual performance reports. -
Year to Date
The Year-to-Date Return shown in the Our Results tool does not include the performance of the private asset classes until they are received, at which time the return graph is updated to reflect those returns. The return graph is intended to provide an estimate of the portfolio’s performance over the course of the year and is subject to revision throughout the year as explained in the note below the graph.
How we measure up
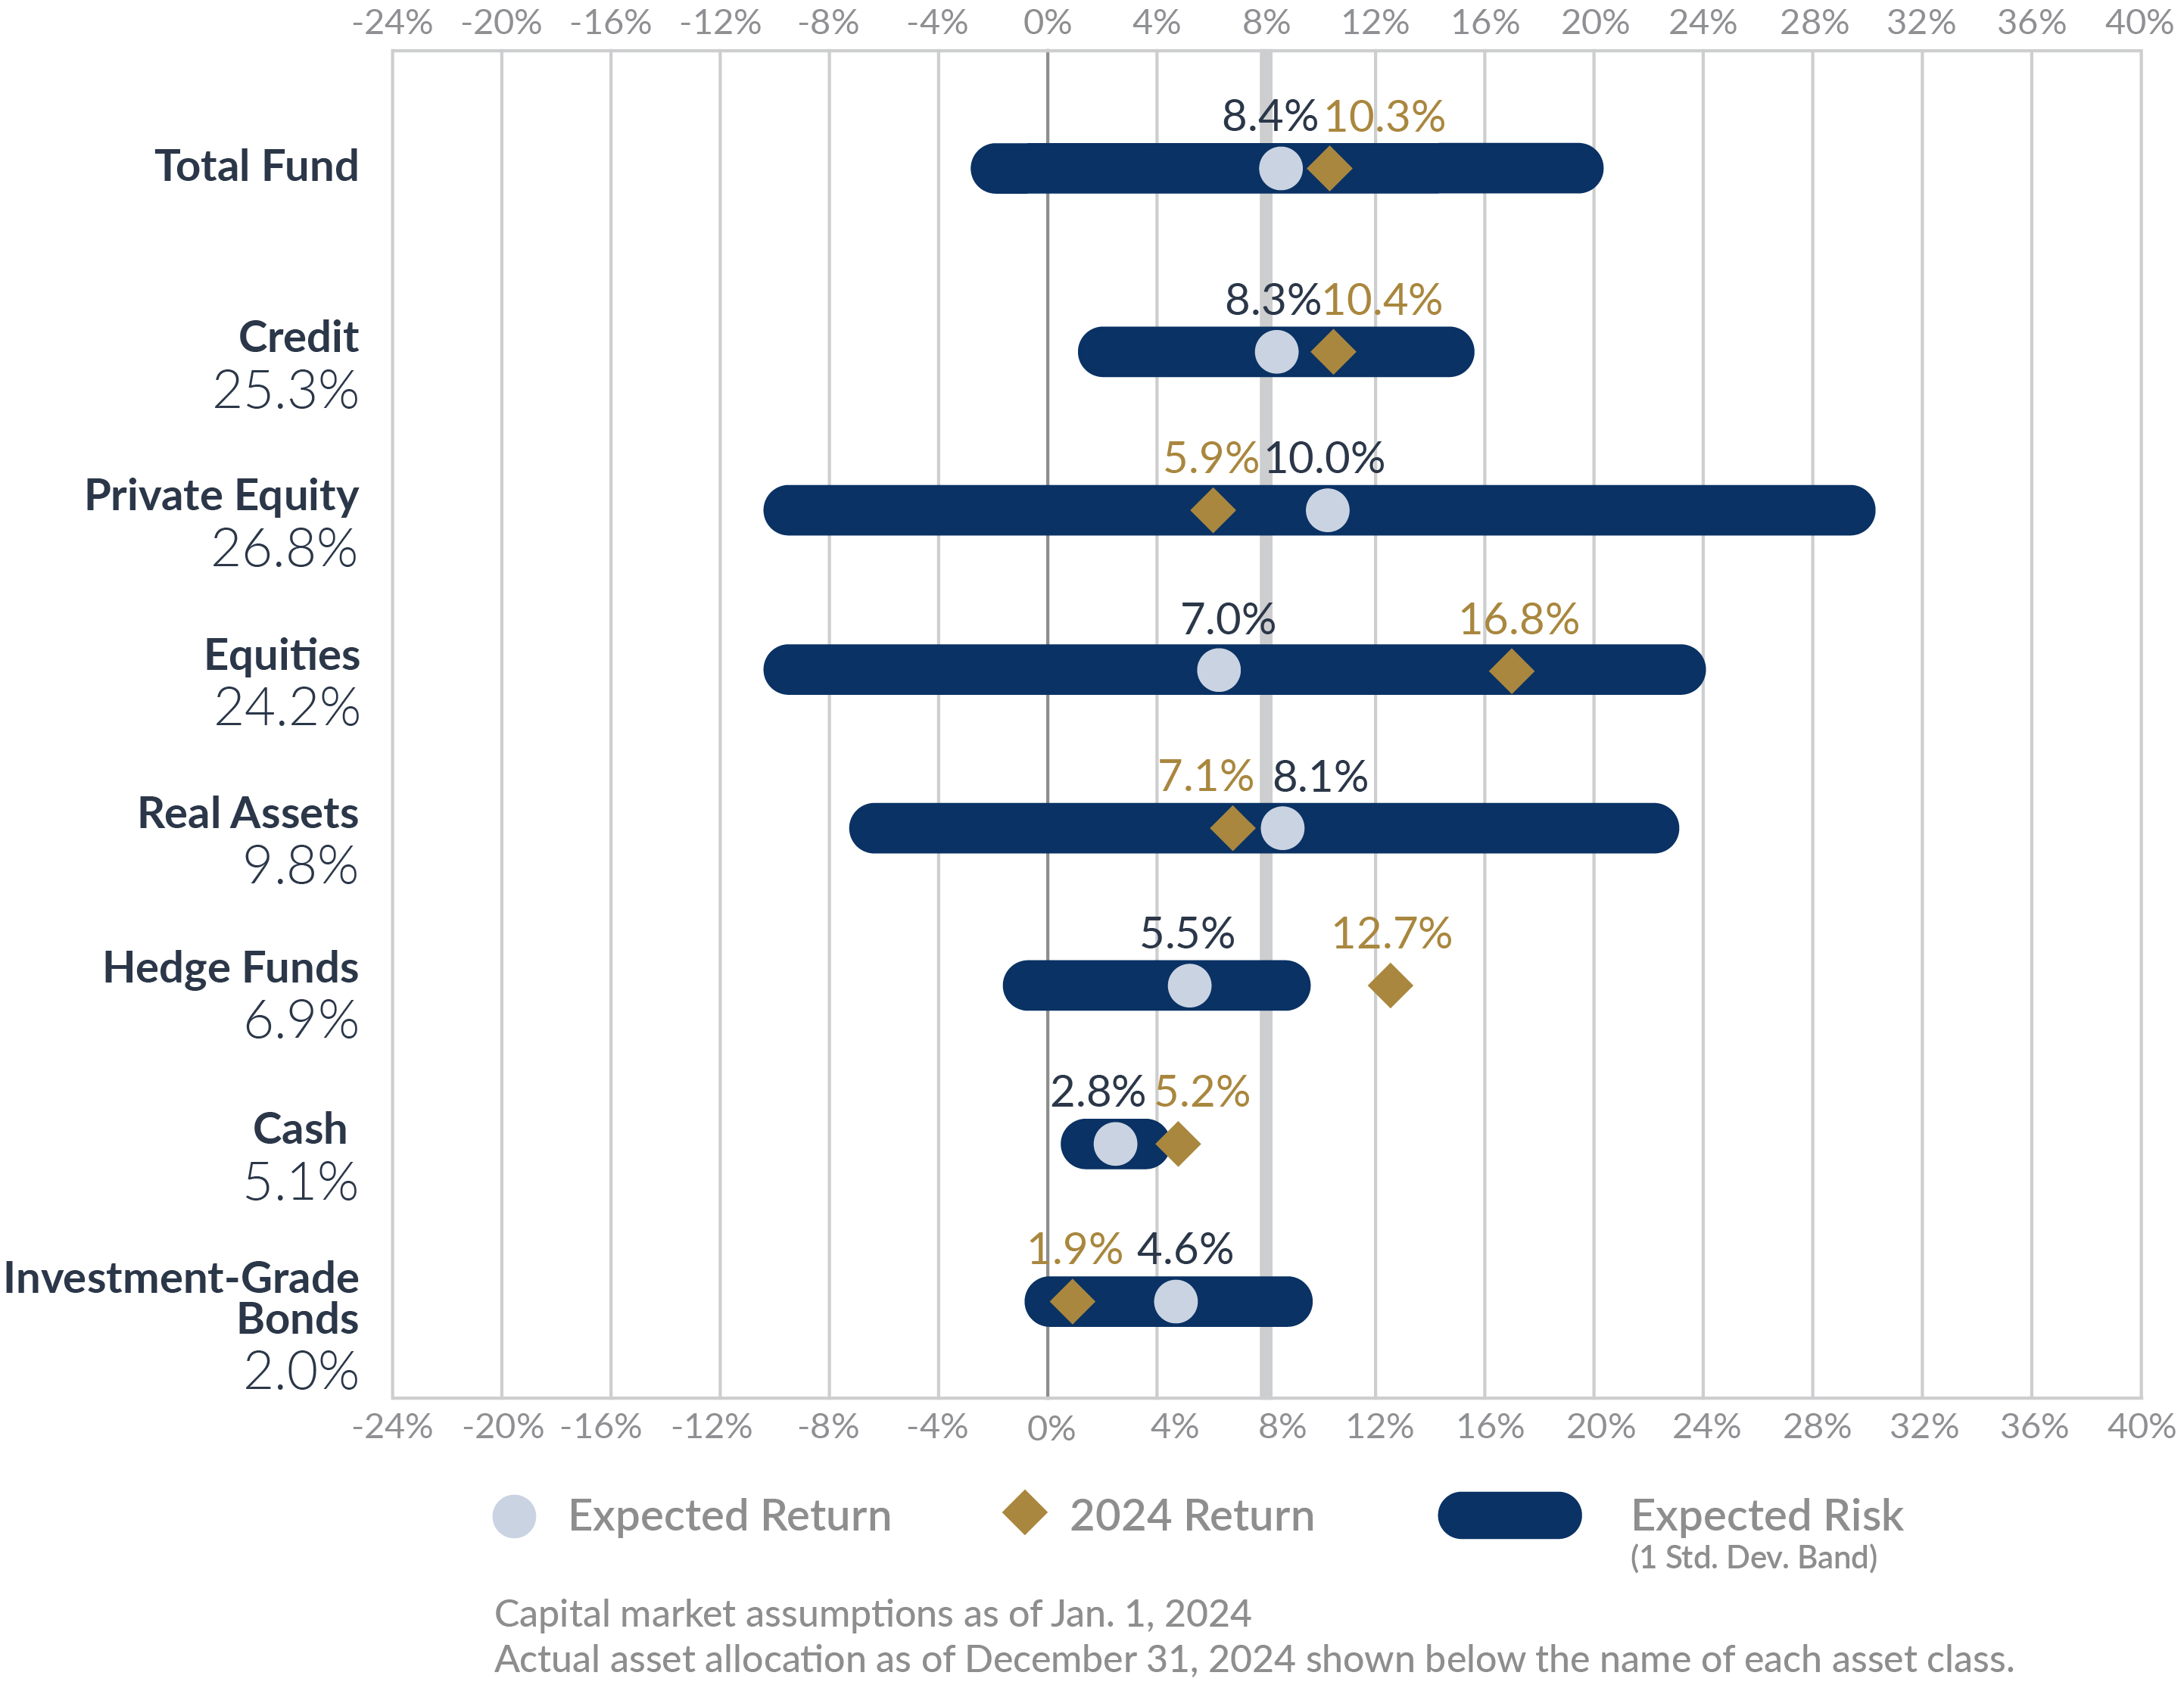
To measure the performance of our portfolio as a whole, we use a policy benchmark portfolio. This hypothetical portfolio is made up of individual asset class benchmarks that are weighted to reflect our target asset class allocation.

Historical benchmark information is available upon request.
We also compare the performance of each asset class and investment manager to a benchmark. This lets us see not only how each asset class performed, but also the value each investment manager added to the assets under their management.
The Bank of NY Mellon serves as the independent performance analyst for our investment performance. Each quarter, they calculate our performance and report it to the TCDRS Board of Trustees. We ask them to report across many time periods on our portfolio as a whole, on our asset classes, and on our investment managers.
Related Content
Get more information on why TCDRS is a model plan when it comes to retirement.

Managing Investment Risk
Risk is a factor in any investment, and we manage risk very closely. Fortunately, we have a great track record of meeting our perform...
Read more
Keeping Investment Costs Low
Our large fund size creates unique economies of scale that make our investment process more efficient. We never charge fees to our pa...
Read more
04.01.2022
How 2021 Investment Performance Impacts Employer Rates & TCDRS Reserves
Thanks to the 2021 investment return, TCDRS and your plans are in a very strong position as we navigate the challenges and market vol...
Read more